For multifamily acquisition teams
Most crime scores are estimates from a formula you can't inspect. PropSafety counts what was actually reported, and tells you where every number came from.
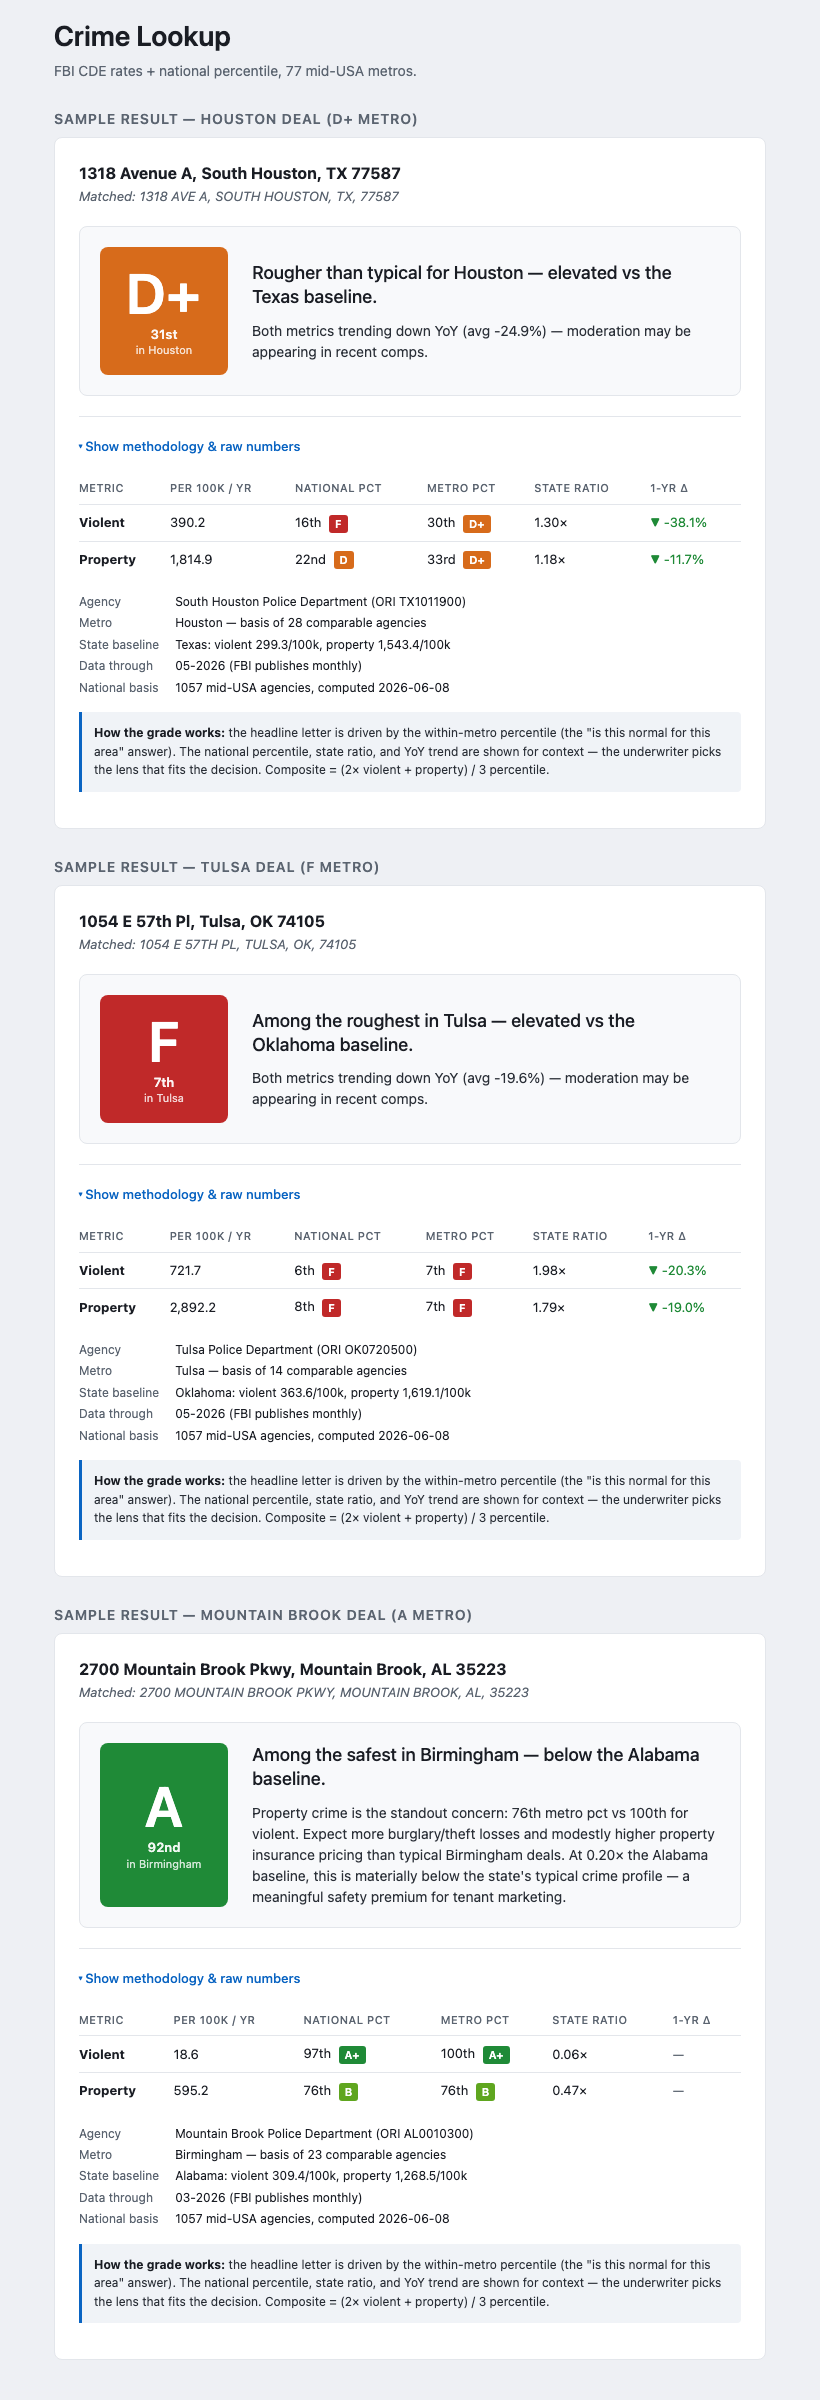
What you get. Type an address. You get a national percentile, a within-metro rank, a state-baseline ratio, a letter grade, and one plain-English line you can put in a memo. Every figure carries its source, its basis size and its data date.
Where it works. 152 metros, 3,485 policing agencies. In 34 cities and counties that publish their own incident records we also show the mile around the address itself, ranked against the rest of that city. Everywhere else the figures cover the whole police department's area, and every card says which one you're reading (full list).
Where it comes from. FBI Crime Data Explorer. No proprietary score, no black box, no modelled estimates. The methodology stays visible so an analyst can defend the number, not just cite it.
Three lookups on an email. No card, no password. Early Access pricing for the first 50 customers, grandfathered forever. Cancel anytime, 30-day money back.
Type an address. PropSafety geocodes it, identifies the policing agency, pulls reported violent and property crime from the FBI Crime Data Explorer, and ranks it three ways: against the national basis of 3,485 agencies across 152 metros, against other agencies in its own metro, and against the state baseline. You get a letter grade, the underlying rates, and a one-line plain-English summary, plus the year-over-year direction, shown only when the change is larger than the agency's own sampling noise, so a small department's random swing is never dressed up as a trend.
Every figure is traceable to the agency, the source dataset, and the publish date. No proprietary scores. No black boxes. The methodology sits behind a "Show methodology" disclosure so an analyst can defend the number in front of the IC.
3,485 policing agencies across 152 metros. Coverage now spans the Northeast, Southeast, mid-USA, mountain west, Pacific Northwest, and California. The markets multifamily acquisition teams actually run deals in. New metros added as customer signal directs.
The letter is the national percentile across all 3,485 agencies, so the same grade means the same thing in every market and two deals in different cities can be compared directly. Beside it, labelled separately: the within-metro percentile (is this normal for Houston?), the state-baseline ratio, and the median rate for agencies serving a similar population, because a 500,000-person city and a small town are not the same question.
Print to PDF, or copy a plain-text citation, and every figure travels with its source, its basis size and its data date attached. That is the difference between a screenshot and something that can go in an IC memo and survive being questioned.
Source: FBI Crime Data Explorer. Agencies report on their own schedules, so every figure carries the exact month it came from rather than one date stamped across the site. Current coverage runs from 12-2025 to 06-2026 depending on the agency. No "real-time" claims we can't honor. No re-licensed third-party data that could vanish. Public domain, defensible at the IC.
One plan during Early Access. Built for individual analysts and small acquisition teams.
Early Access
First 50 customers grandfathered at $49 forever, as long as the subscription stays continuous. After Early Access closes, the plan is $99/mo (Pro). No long-term commitment.
For the underwriting analyst. You're the one who has to answer when somebody asks where the number came from. PropSafety gives you a count, a source, a date, and one line you can put in a memo. Nothing you have to take on faith.
For anyone buying outside their own market. You have no local instinct to check a number against, which is exactly when a modelled score is hardest to argue with and easiest to be wrong about. Every figure here traces to a named dataset and a date, so you can check it instead of trusting it.
For the acquisitions VP or Director. Your team is citing a different source in every market and none of them compare to each other. PropSafety standardizes the input so two deals in two cities can be read side by side, and every figure carries a source your team can name in committee.
I'm Kobina. I'm on the acquisitions team at a syndication shop, where I run several underwriting meetings a week as the underwriting SME.
In every one of them we ask what the crime is like at the property. We had tools, and they gave us a number. But the number was a model output, an estimate from a proprietary formula, and I couldn't show my work. You can't defend "the index says 87" to an investment committee.
Most of the deals I look at are in markets I don't live in, so there was no local instinct to check it against either.
I could pull income, rents and comps in twenty minutes and show exactly where each number came from. Crime was the only input I couldn't do that with.
So I built this for myself. I use it on my own deals. If it's useful to you too, it's $49 a month.
If something is wrong or missing, email me directly at support@propsafety.io. I read all of it.
PropSafety is a product of Thoughtful Services and Investments, LLC, a Texas-registered limited liability company that operates the PropSafety subscription service. PropSafety is the LLC's data-software product line, distinct from its real-estate advisory work, with its own product, billing, and support channel at support@propsafety.io.
All subscription billing for PropSafety is processed by Thoughtful Services and Investments, LLC. Charges on your card statement will appear as "PROPSAFETY" or "THOUGHTFUL SERVICES."